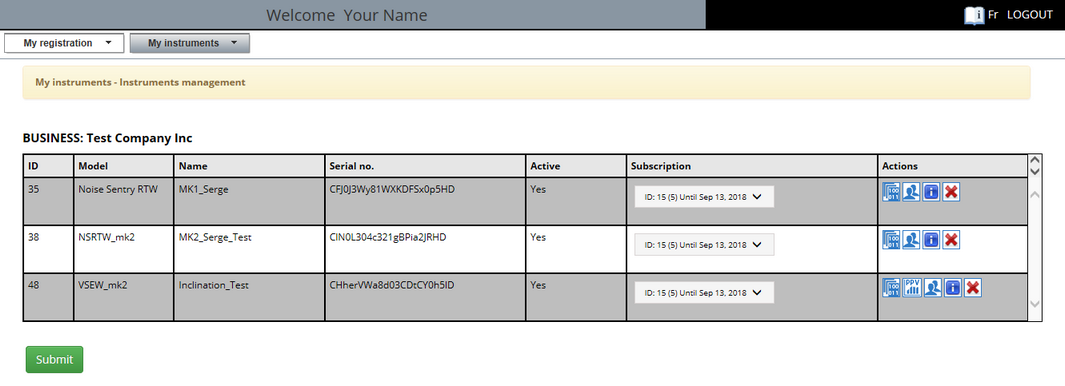
A typical example of the Data Download Table is shown here:
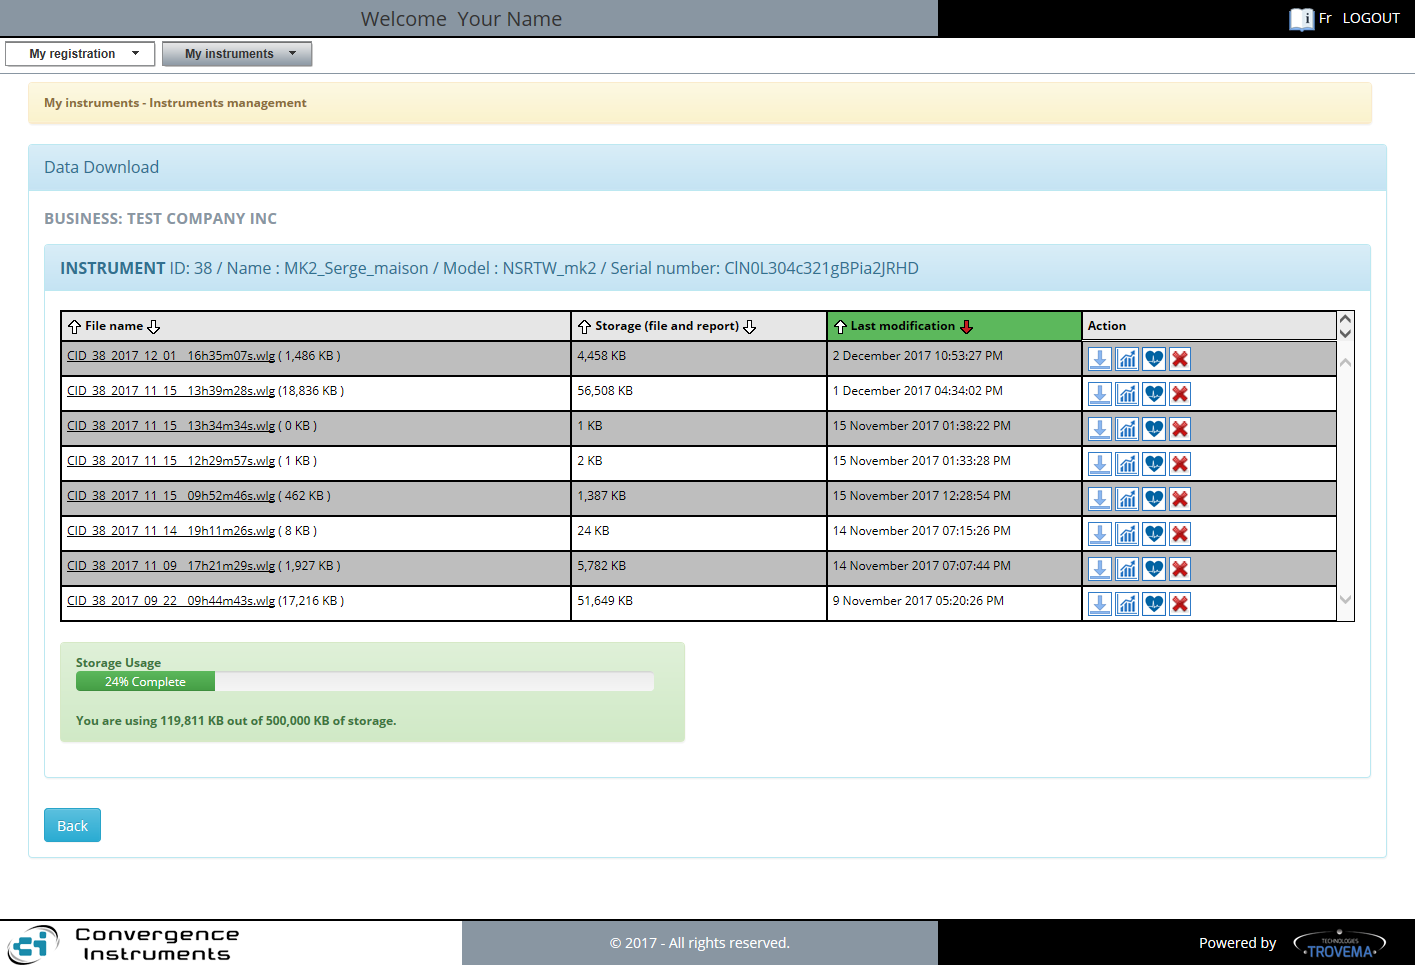
Notice that the tool shows an "Instrument's Bar" providing details to better identify the instrument, followed by a Data Download Table constructed of the following four columns:
| 1. | "File name": This is instrument's recorded data file saved in the CIDataSolutions Cloud Storage. |
| 2. | "Storage": This is your total Cloud Storage Usage for keeping that particular record in your instrument's Cloud Storage Space. |
| 3. | "Last modification": The last time your instrument's recorded data was transferred successfully from your instrument through the WiFi connection and appended to the existing data file saved on its related Cloud Storage. |
| 4. | "Actions": The personalized list of tools available for you for a particular instrument. A click on one of these "Action Icon" launches the tool with the particular instrument's ID. See next section for more details. |
The table also features a "Vertical Scroll Bar", allowing to scroll up and down to find more records among a long list.
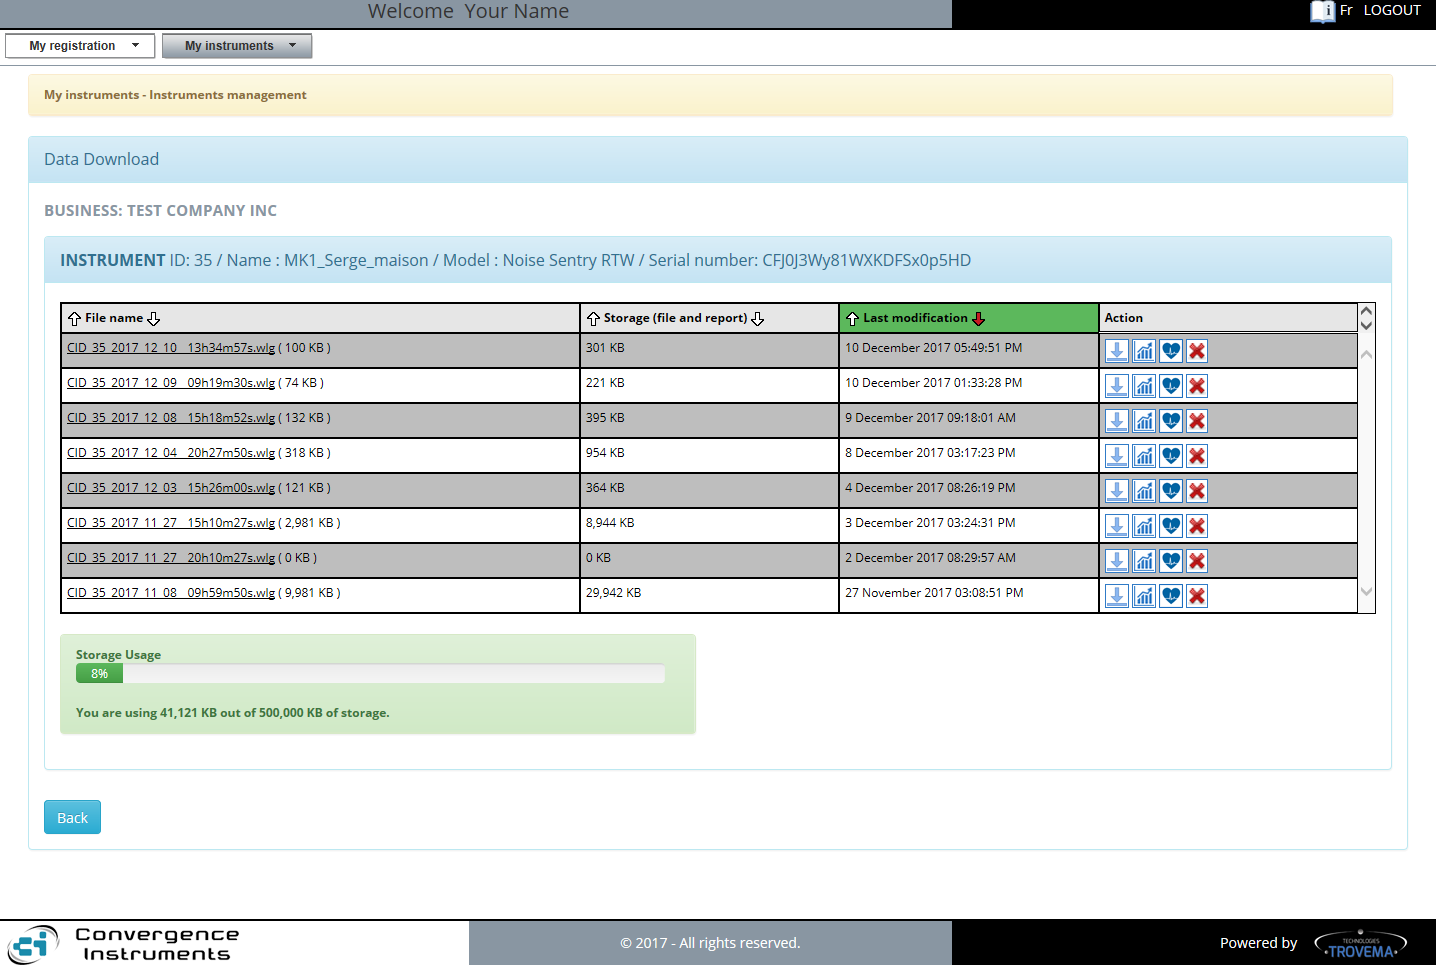
Note that the user can easily sort the table by "File name", by "Storage" or by "Last modification" date. All he has to do is click on the "Up"  or "Down" or "Down"  Arrow on any column title to change the order of the table. When the sort is active, the background colour of the "Title" for the selected column turns "Green". The "Red" arrow indicates the active sort order. Arrow on any column title to change the order of the table. When the sort is active, the background colour of the "Title" for the selected column turns "Green". The "Red" arrow indicates the active sort order.
The size of the Recorded data file is given aside the file name and extension. The recorded data is not only stored in the database, it is also decompressed and pre-processed for future use. The resulting pre-processed data is stored in the Cloud Storage. These files will later be used to speed-up the construction of your on-demand graphics. The file storage takes about three times the size of all of your data records (wlg files).
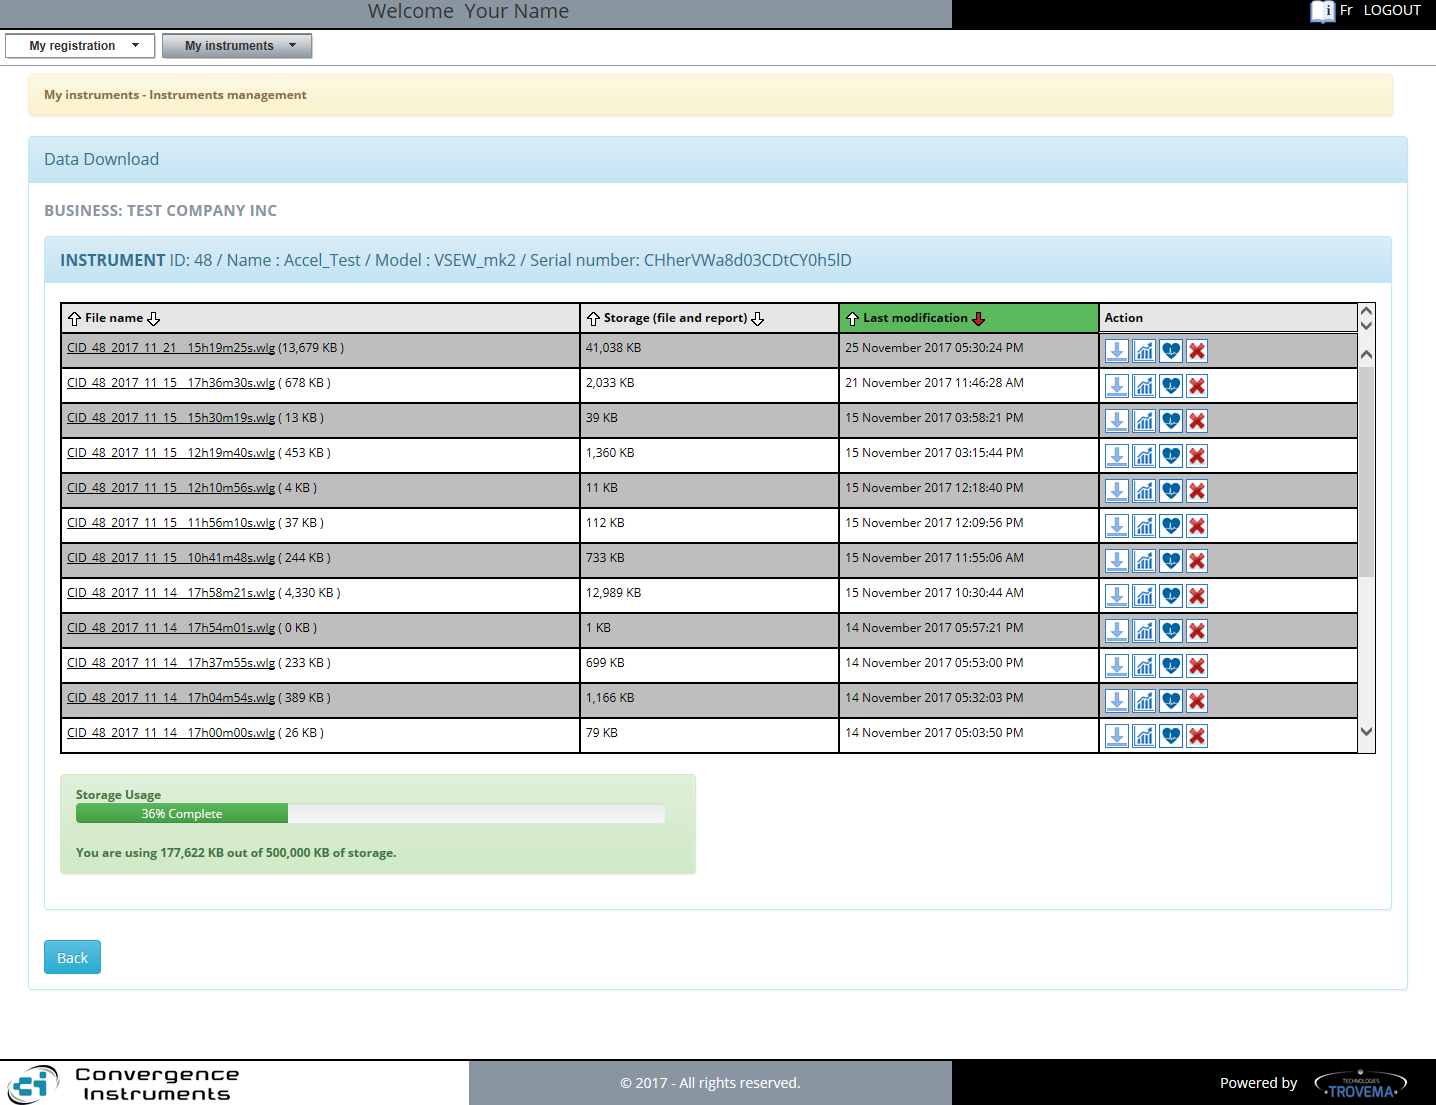
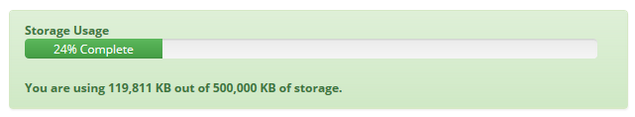
Below the table, the Storage Usage is shown to the user by the mean of a "Progress Bar", in percentage of the total Storage Capacity for a particular instrument, by colour, so the user can always be fully aware of the instrument's Cloud Storage Usage in order for him to determine the best moment to clean-up instrument's associated files.
The "Progress Bar" is shown in green when the percentage of usage is below 80%.
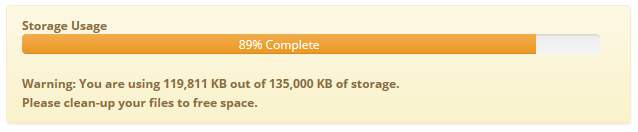
When usage goes between 80% and 90%, the Progress bar is shown in orange, meaning Cloud Storage Usage is approaching its limit and user should give it his attention.
And when the usage surpasses 90%, the Progress Bar is shown in red, meaning user should do a clean-up of his instrument's files NOW.
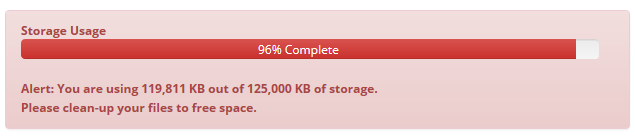
The CIDataSolutions Server runs a routine once a day to discover critical storage situations. When using more than 95% of the Storage Capacity, the CIDataSolutions Server sends a warning email to your CIDataSolutions Account Administrator with details about the Cloud Storage situation of your instrument, so someone in your group take the responsibility to download important recorded data files to the local computer and then remove those files from the Cloud, making room for the new incoming records from that instrument.
INSTRUMENT: Name : Accel_Test / Model : VSEW_mk2 / Serial number: CHherVWa8d03CDtCY0h5lD
STORAGE: Capacity: You are using 143,526 KB out of 150,000 KB of storage.
Your instrument has reached its Storage Limit on the CIDataSolutions Server. Please cleanup your data files to free some storage space. To keep local copies of your data files, first use the  "Download" tool to download them to your local PC. Then use the "Download" tool to download them to your local PC. Then use the  "Remove" tool to remove them permanently from the web storage. "Remove" tool to remove them permanently from the web storage.
Note: The CIDataSolutions Server will automatically remove oldest files (FIFO) when the limit is reached, to free 20% of the storage capacity in order to make room for the incoming new files. If you would like to use more Storage Capacity for this instrument, please contact Convergence Instruments Sales Representative.
Thank You for your business.
The CIDataSolutions Team
|
If no action is taken and the Storage Usage exceeds the Storage Capacity Limit of that instrument for more than 24 hours, the CIDataSolutions Server will automatically remove files to free up your Cloud Storage Space for making room for the incoming new records. The email shows the Instrument's Cloud Storage Capacity, Cloud Storage Usage reached before files removal (FIFO) and the new Cloud Storage Usage value after the removal.
INSTRUMENT: Name : Accel_Test / Model : VSEW_mk2 / Serial number: CHherVWa8d03CDtCY0h5lD
STORAGE:
Capacity: 140,000 KB
Usage before removal: 143,526 KB
Usage after removal: 102,159 KB
The Storage Usage of your instrument has exceeded its Storage Capacity on the CIDataSolutions Server for more than 24 hours. Notifications were sent every day since the instrument has reached 95+% of its Storage Capacity. The CIDataSolutions Server has automatically removed the oldest data files (FIFO) from the Cloud to free 20% of the Storage Capacity in order to make room for the incoming new files. If you would like to use more Storage Capacity for this instrument, please contact Convergence Instruments Sales Representative.
Thank You for your business.
The CIDataSolutions Team
|
If you would like to keep more recorded data on the Cloud for that particular instrument, please contact a sales representative at Convergence Instruments, so he can set you up a subscription that better fit your needs for that particular instrument.
There are four "Action" tools available within the "Data Download" table:
| 1. | "Download Recorded Data file" tool: A click on this tool informs your browser to start the transfer (Download) of the associated "wlg" file from the CIDataSolutions™ Database to the "Download" directory on your PC. It can later be copied to a project directory using Operating System tools on that PC. |
| 2. |  "Show Statistics Data file" tool: This graphical tool converts the binary data inside the selected recorded data wlg file to curves that could be presented in graphs. "Show Statistics Data file" tool: This graphical tool converts the binary data inside the selected recorded data wlg file to curves that could be presented in graphs. |
| 3. |  "Graphical view of instrument's health" tool: Used to show in part the graphic content of a specific wlg format data file. Health graphs presented are: instrument temperature, battery and voltage recorded over a period if time. "Graphical view of instrument's health" tool: Used to show in part the graphic content of a specific wlg format data file. Health graphs presented are: instrument temperature, battery and voltage recorded over a period if time. |
| 4. | "Remove" Data file tool: The removal of the old recorded data file is acceptable and even considered as a good practice for cleaning database residuals of projects once they are completed. |
 "Download Data file" tool: "Download Data file" tool:
"Download Data file" tool: A click on this tool informs your browser to start the transfer (Download) of the associated "wlg" file from the CIDataSolutions™ Database to the "Download" directory on your PC. It can later be copied to a project directory using Operating System tools on that PC.
|
"Statistics Data graphs" tool:
"Statistics Data" graph tool: This graphical tool converts the recorded data, found inside the selected record wlg file, to curves that could be presented on single or multiple graphs.
The Noise Sentry instruments transmit their recorded data at the moment the instruments connects to the Listener successfully. If the transmission is not successful, the process retries at the next log interval. This process will not stop until all the content is transferred successfully.
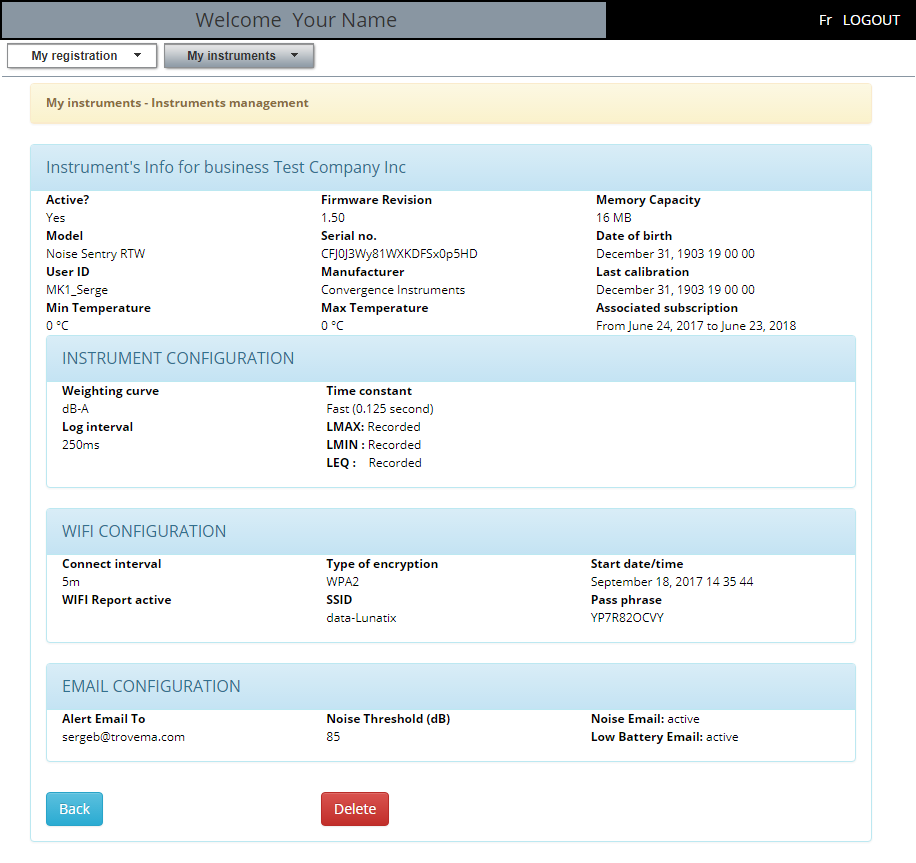
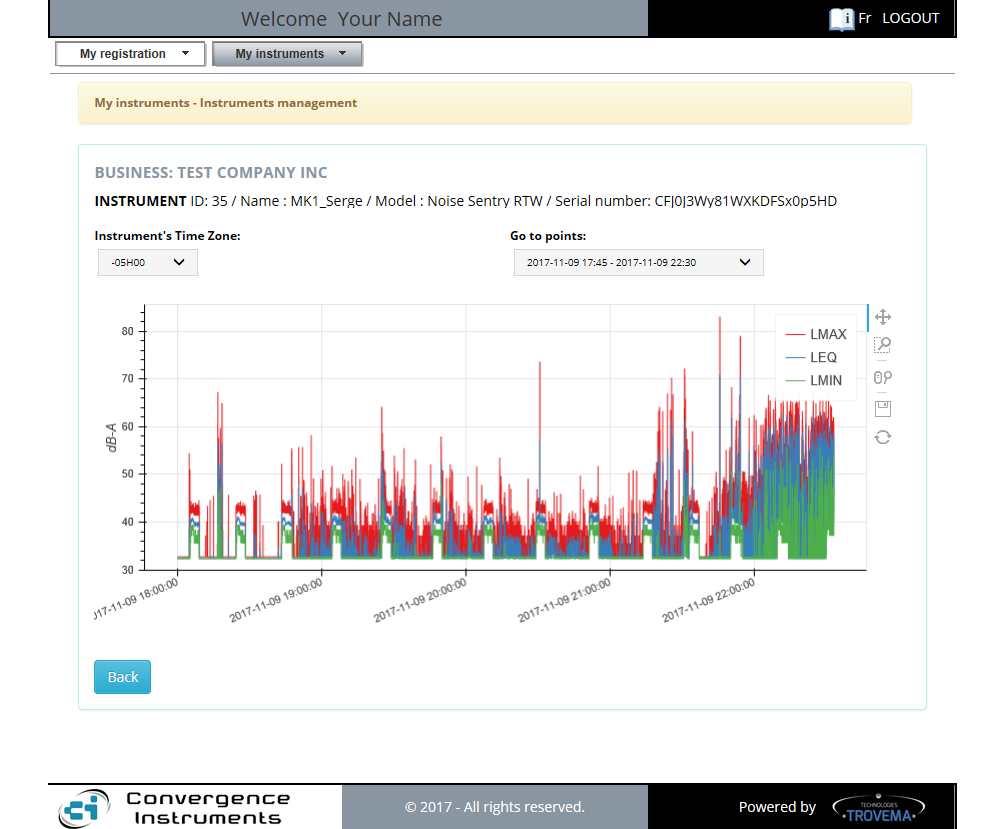
The Statistics for the Noise Sentry instrument is always represented by three possible curves: Lmax, Leq and Lmin.
The Statistics graphs report is composed of the following:
| 1. | "Business Name": Normally set to your Business. |
| 2. | "Instrument identification": That is: Instrument's ID, Nick Name, Model, Serial Number. |
| 3. | "Instrument Time Zone" selector: Delta hours with UTC at GMT, where the instrument is located during its recording. |
| 4. | "Go to points" selector: When more than 28k points are available, the report is divided into slices. The selector gives access to these slices. The default slice shown is always the latest recorded. |
| 5. | "Statistics graph": A representation, in dB or linear (Pa) scale, of the noise recorded by the instrument over time. Up to three curves can be presented on the graph: L-max, Leq and L-min. |
|
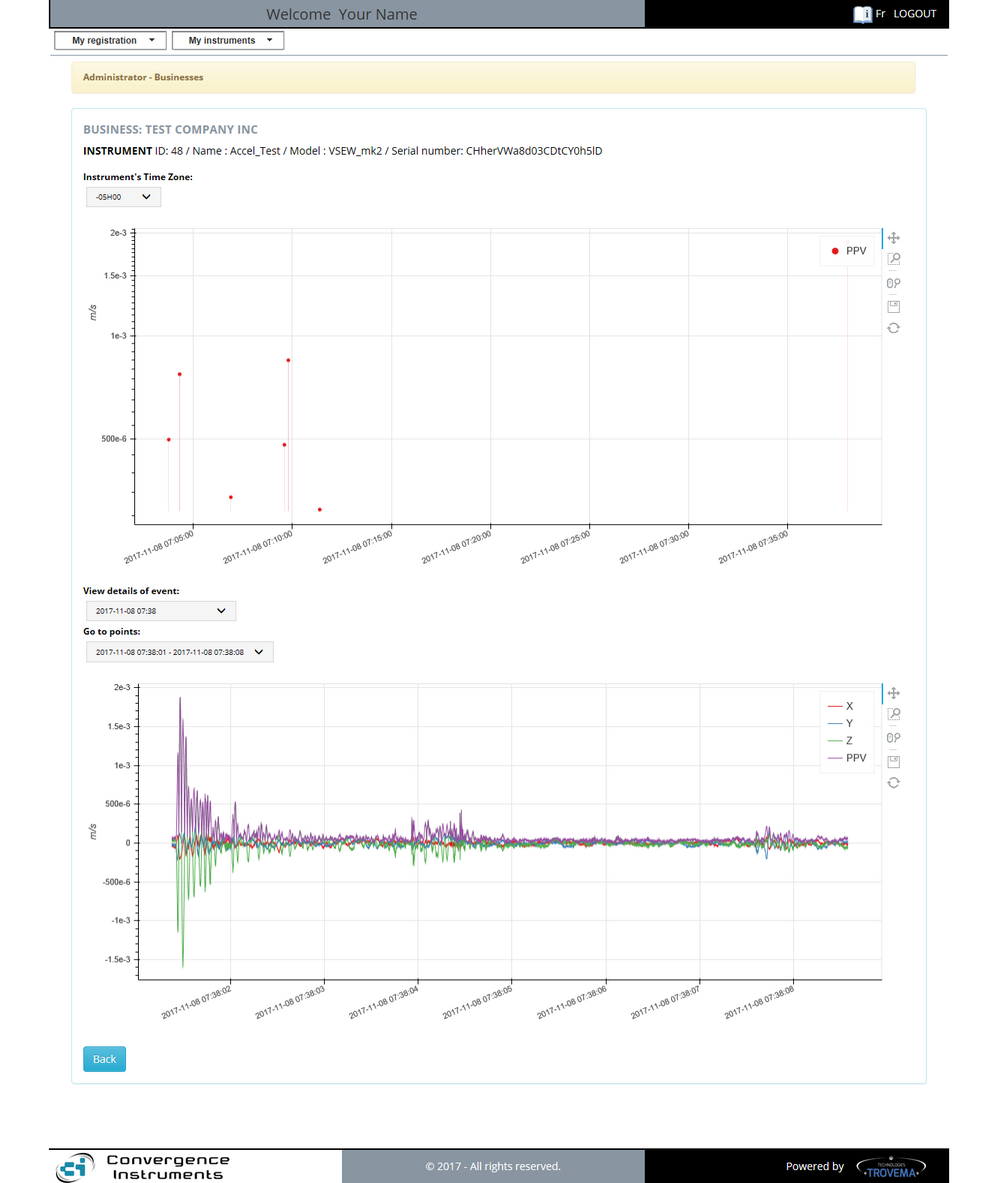
The Vibration Sentry instruments transmit their recorded data at the moment the instruments connects to the Listener successfully. If the transmission is not successful, the process retries at the next log interval. This process will not stop until all the content is transferred successfully.
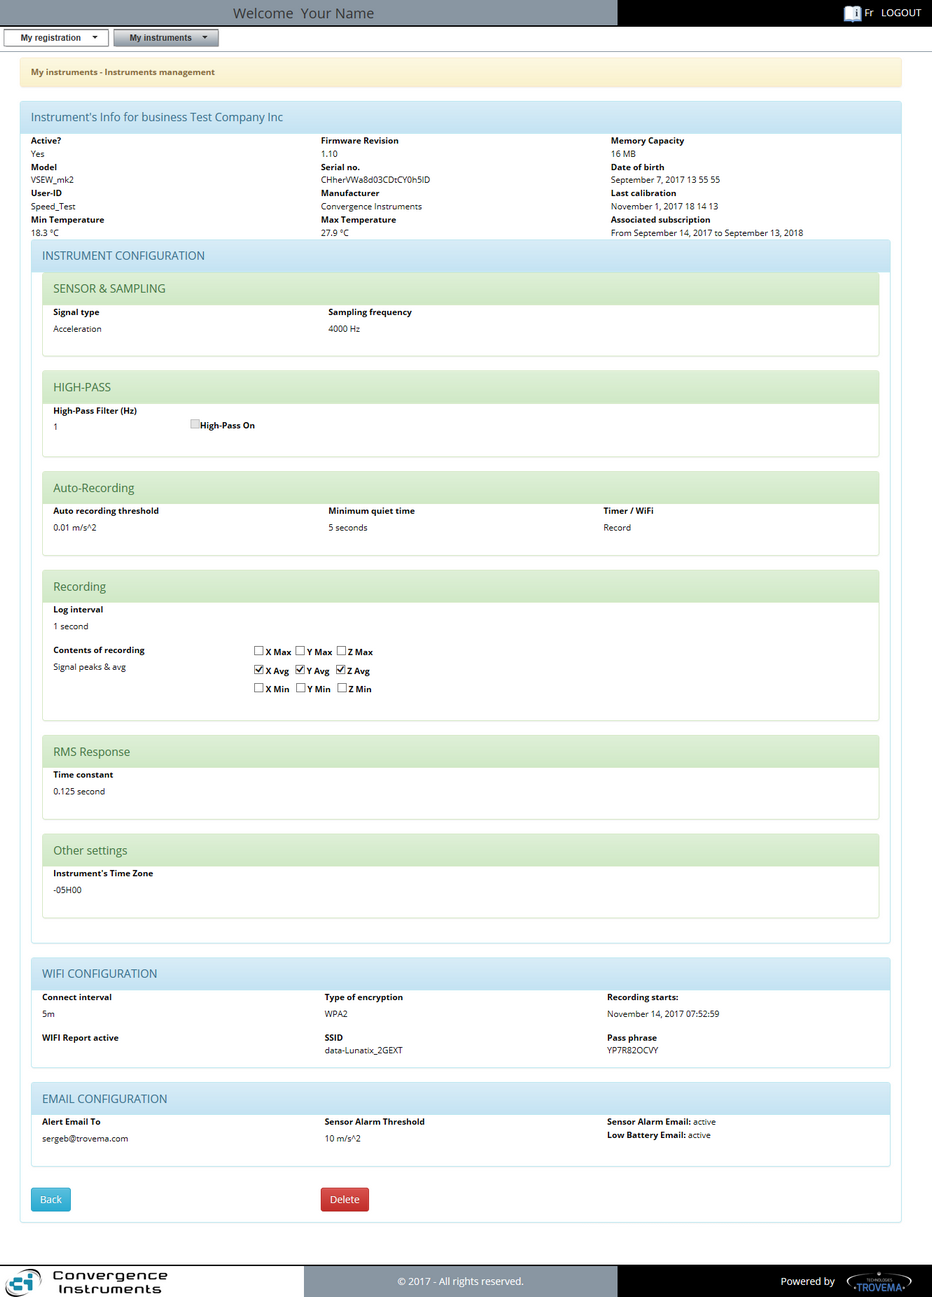
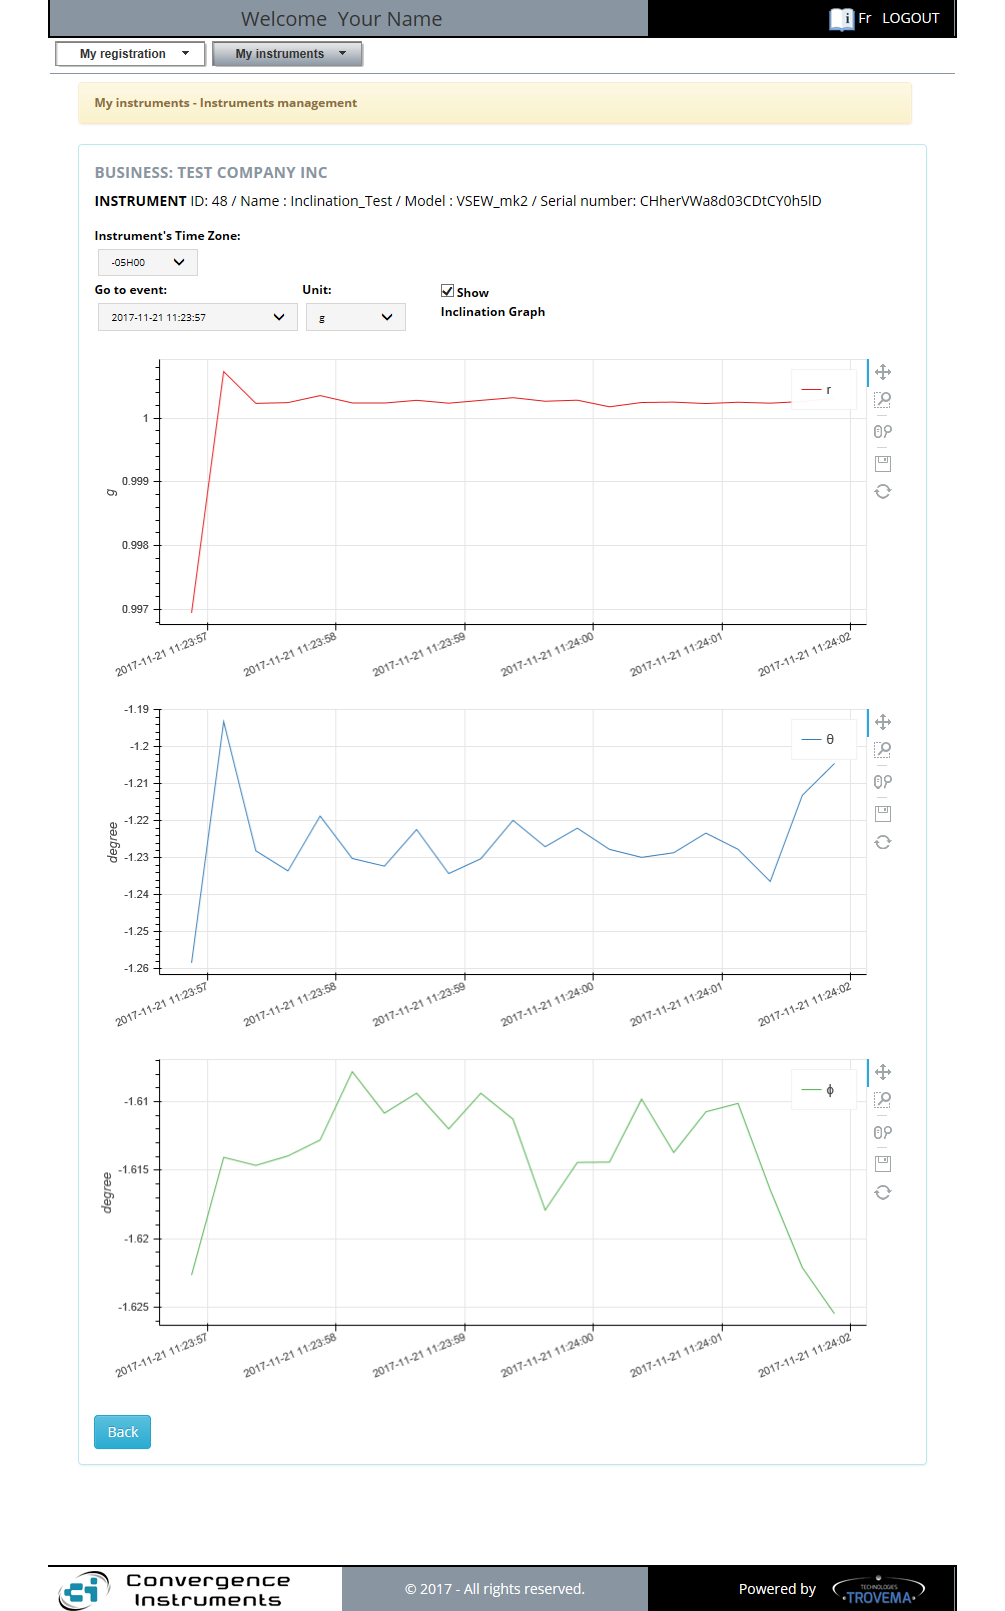
The Statistics for the Vibration Sentry instrument can be of two natures:
The Statistics graphs report is composed of the following:
| 1. | "Business Name": Normally set to your Business. |
| 2. | "Instrument identification": That is: Instrument's ID, Nick Name, Model, Serial Number. |
| 3. | "Instrument Time Zone" selector: Delta hours with UTC at GMT, where the instrument is located during its recording. |
| 4. | "Go to event" selector: When more than 28k points are available, the report is divided into slices. The selector gives access to these slices. The default slice shown is always the latest recorded. |
| 5. | "Units" selector: When statistics are of "Acceleration" nature, units can be shown in "g" or "m/s^2", in linear or dB scale for RMS values. When viewing "Velocity" statistics, scale unit is in "m/s" in linear or dB scale for RMS values. By default the graphs display signals or RMS levels on per-axis basis. But when the "Show Inclination Graph" check-box is set, if the recording includes at least the average acceleration along the tree axes, then the graphs show the norm (Rho) in "g", the "Theta" tilt, in degrees, around the X-axis, and the "Phi" tilt, in degrees, around the Y-axis. |
| 6. | "Statistics graphs": Acceleration over time graphs can represent: |
| 1. | Raw data for the X, Y and Z axis, totalizing up to three graphs with one curve each; |
| 2. | Peaks and Average data for the X, Y and Z axis totalizing up to three graphs with three curves each; |
| 3. | RMS Peaks and Average data for the X, Y and Z axis totalizing up to three graphs with three curves each; |
| 4. | Inclination data, in Polar coordinates, if Acceleration was captured for at least the average data on the three axes; |
and Velocity, where a single graph includes up to three curves: X, Y and Z.
|
|
"Instrument Health" graph tool:
Instrument Health graphs:
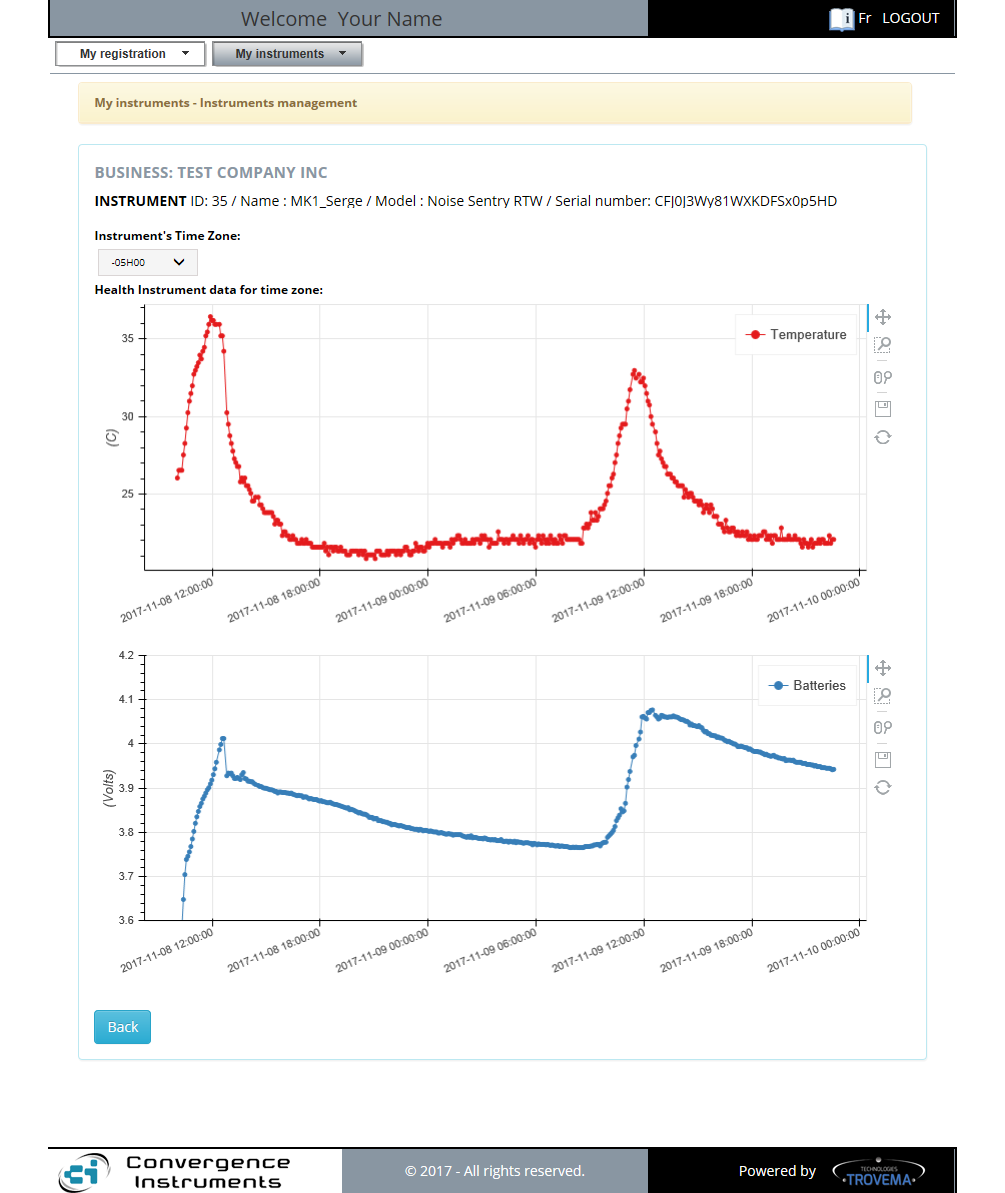
All instruments transmit their health data at the moment the instruments connects to the Listener successfully.
Health of an instrument is represented by:
| 1. | Temperature of the instrument; |
| 2. | Battery Voltage of the instrument. |
The Health graphs report is composed of the following:
| 1. | "Business Name": Normally set to your Business. |
| 2. | "Instrument identification": That is: Instrument's ID, Nick Name, Model, Serial Number. |
| 3. | "Instrument Time Zone" selector: Delta hours with UTC at GMT, where the instrument is located during its recording. |
| 4. | "Temperature graph": A representation of the instrument's temperature cycles, in Celsius or Fahrenheit degrees over time. It is close to the inside/outside environment temperature where instrument is located. |
| 5. | "Battery Voltage graph": A representation, in Volts over time, of the charge and load cycles of the instrument's battery. |
|
"Remove" Data file tool:
"Remove" Data file tool: The removal of the old data file is acceptable and even considered as a good practice for cleaning database residuals of projects once they are completed.
WARNING: You should always make sure you have downloaded and "Backup" the data files to your preferred "Storage device" before removing a wlg file.
|
|
|
 Instrument Management Toolkit