8.5 Spectrum Tab

Contents
The Spectrum tab is shown on Figure 11. When that tab is selected the time-domain signals captured by the instrument are presented in the form of averaged power spectra. The processing is as follows:
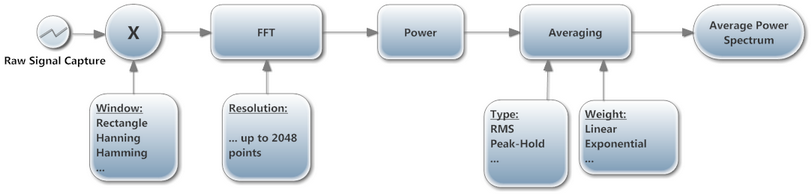
Figure 17 (-> shows the defaults)