6.5.4.1 Acceleration Noise
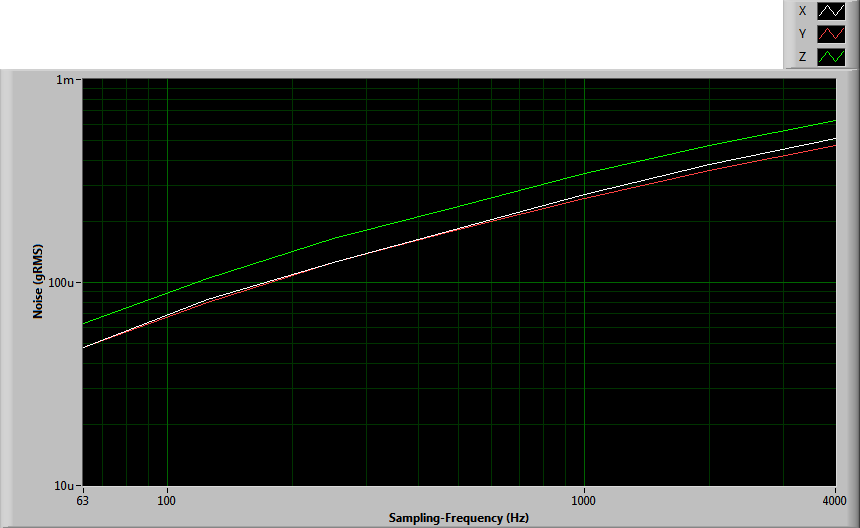
Figure 6 shows the RMS noise along the three axes, as a function of sampling frequency.

Figure 6
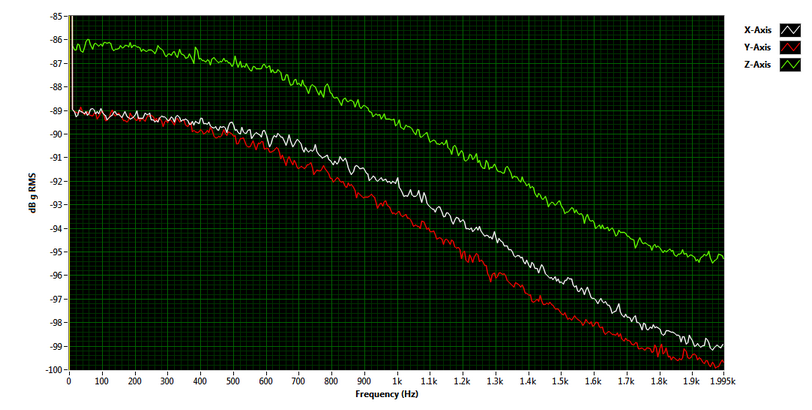
Figure 7 shows the acceleration noise spectrum when the accelerometer is sampling at 4 kHz.

Figure 7
Figure 6 shows the RMS noise along the three axes, as a function of sampling frequency.

Figure 6
Figure 7 shows the acceleration noise spectrum when the accelerometer is sampling at 4 kHz.

Figure 7